Photo Credit: Fred Fullerton
Waders are the New Uggs
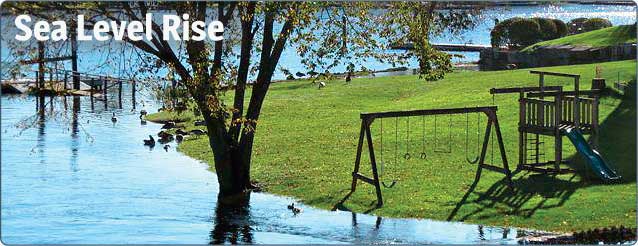
By now everyone has heard the stories about how low-lying islands will disappear and waterfronts will be washed away by the year 2100 due to sea level rise. The team of international experts that made that projection back in 2004 now look conservative in their predictions. Scientists now tell us that the impacts of sea level rise are probably going to be much worse than we thought.
How Does It Happen?
Sea level rise occurs on both global and local scales. Two major processes cause global sea level rise: melting land-based ice sheets, and thermal expansion of water. Melting of land-based ice sheets simply raises sea level by adding water that had previously been located on land to the oceans. Thermal expansion is an effect that works something like giving candy to a room full of children. The sugar in the candy gives each child more energy, causes them to move around more, and the children take up more space in the room. Heat adds energy to water molecules, causing them to move more and occupy more space.
Local sea level change is the change observed at a particular location, and it can be very different from the global average in sea level depending on where you live. Local sea level changes can be caused by land subsidence, or downward movement of the terrain relative to sea level, due to the earth’s response to ice or sediment loading, or the extraction of water or oil. The contribution of land subsidence to sea level rise varies at regional and local scales. (Anyone who has ever had a potted plant has observed subsidence as the soil in the pot appears to shrink.)
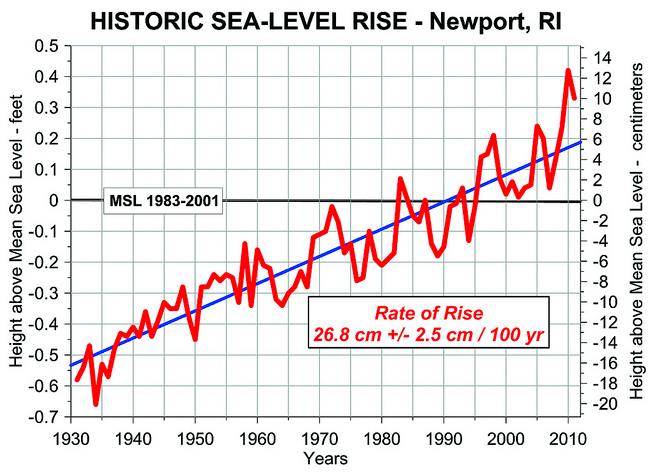
There is evidence that the coastline from Cape Cod to New Jersey is subsiding, but the exact rate is uncertain. When subsidence is taken into account, Rhode Island’s historic rate of relative sea level rise as observed in Newport is thought to be greater than the average around the globe.
Hans Brinker and the Pearly Gates
Projections versus Predictions
Projections are not predictions. Projections are based on a sequence of hard data that shows trends, whereas the word predictions is more readily associated with crystal ball gazers or local TV forecasters, whose accuracy is usually as reliable as a race track tout’s picks.
But if climatologists have erred in any way in their projections, it is increasingly evident that they have been conservative in their expectations. It is worth repeating: the amount of sea level rise that the Intergovernmental Panel on Climate Change (IPCC) scientists projected would occur by 2100 has already been deemed to be far too low, and those predicted rates of encroaching waters would likely be exceeded. Jokers in the pack such as large amounts of melting ice in Greenland and Antarctica have now thrown a very ugly monkey wrench into the works, and we can count ourselves lucky if we only experience the relatively low increases in sea levels originally projected by the IPCC in 2007.
Sea Level Projections
Global
- Great variability in sea level rise projections exists because of uncertainty of the contribution of melting sheet ice. Many older analyses did not account for the unexpected rates of rapid sheet ice breakup and melting that have occurred in recent years. New estimates of the increase in global sea level by the end of the century range from 1.6 to 6.6 feet. And imagine that higher sea level in storm conditions with winds driving a storm surge.
Regional
- Regional variations in sea level rise are expected when you take into account things like prevailing winds and that tricky subsidence we discussed above, among other factors.
- Sea levels are rising 3-4 times faster along the east coast from North Carolina to Massachusetts than the global average. Why? Well, it is complicated but it involves ocean currents, temperature changes, and salinity. Dive into the complexity here.
Rhode Island
- Rhode Island has 47 square miles of land lying within 4.9 vertical feet of sea level with an additional 24 square miles between 4.9 and 11.5 feet.
- This 4.9-foot contour roughly represents the area that would be inundated during spring high water with a 2.3-foot rise in sea level. This sea level rise scenario is within current end-of-century projections.
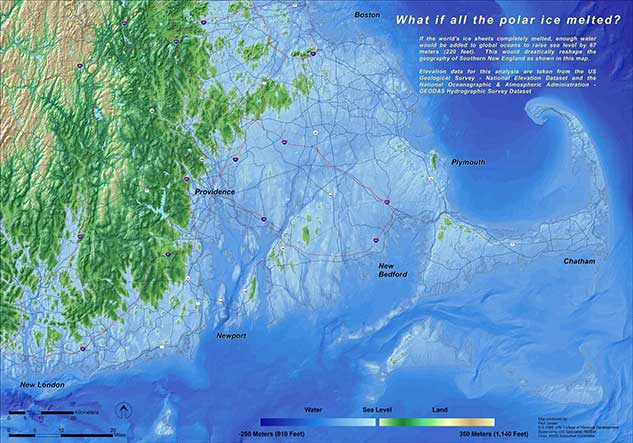
OK, by now you probably fear drowning in numbers more than sea level rise. Just take a look at these maps that really bring home the picture of sea level rise from the most conservative to the more extreme estimates.
Click on the maps to see them larger
“The rate of sea level rise will likely double or triple in the next hundred years...”
“Extremely rapid sea level rise — especially when coupled with decreased sediment supply — can inundate islands causing them to break up and disappear.”
News
Factoids
Average global sea level has increased by 7 inches since 1900, which threatens coastal communities. Since 1930, sea level in Rhode Island has increased by an average of 1 inch per decade.
Over the past half century, sea levels in the Northeast have been increasing 3-4 times faster than the global average rate, resulting in a 6-inch rise between 1970 and 2012.
Sea level is projected to increase by 3 to 5 feet above 1990 levels in Rhode Island by 2100.
Over 55,000 homes in New England are situated less than 3 feet above sea level and will be at risk of inundation by 2100.


